WALHT : find and continue a pattern - recording results in a table and transfer these results to a graph display
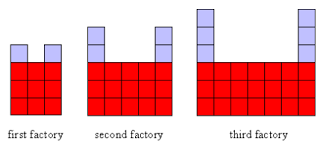
Factory Number
|
1
|
2
|
3
|
4
|
5
|
number of gray squares (x2)
|
2
|
4
|
6
|
8
|
10
|
number of red squares (+6)
|
9
|
15
|
21
|
27
|
33
|
number of all squares
|
11
|
19
|
27
|
35
|
43
|
This graph shows how the red tiles increase by 6 and how the grey tiles increase by 2 with each building.
No comments:
Post a Comment
Note: only a member of this blog may post a comment.